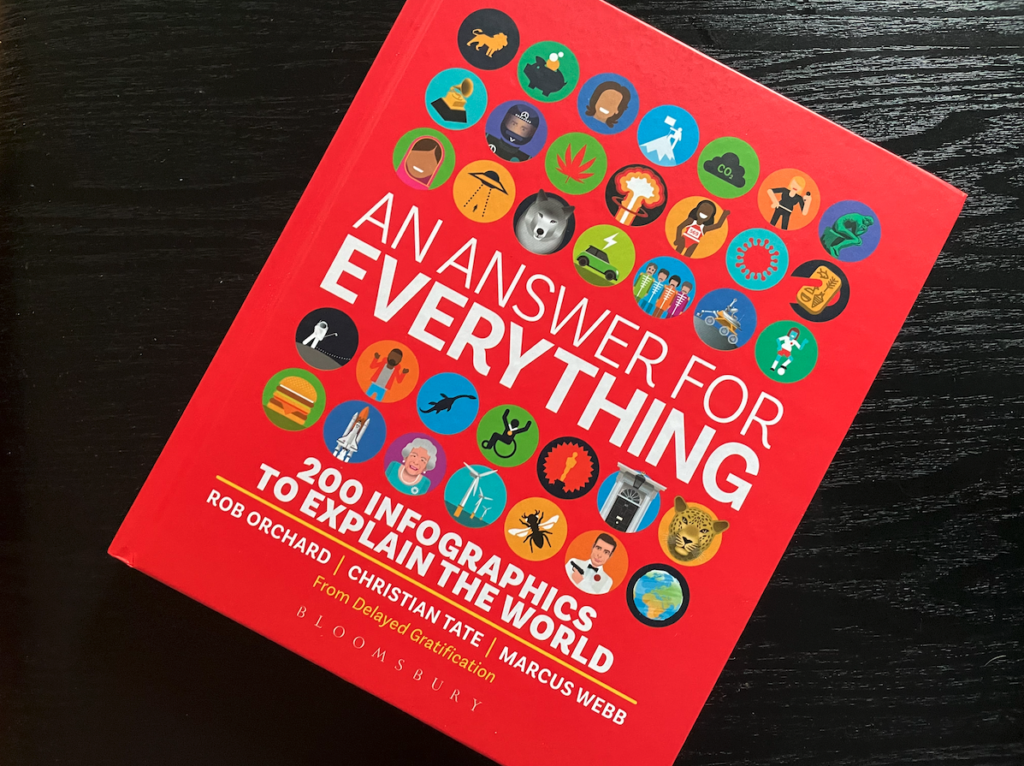
An Answer For Everything: 200 Infographics To Explain The World from Delayed Gratification (Bloomsbury 2021)

My huge thanks to Richard Freeman of Always Possible for the heads up on this astonishing asset to anyone’s library. This is a graphic design gem and an infographic tour de force.
Here are 200 illustrations that beautifully pull together data points and assemble them in jaw-dropping clarity. You will learn – among other factoids – that:
For $6million, Ariana Grande will perform at your party, and for the same price you can have 150 performances by Vanilla Ice.
13 of the most dangerous cities in the world are in Central America.
Among other things, astronauts have left 7 hammers, 27 cameras, 7 flags and 1 falcon feather on the moon.
46% of all the civilian owned guns in the world are in the United States.
There are almost 26 million chickens on our planet.
However fascinating (or not) you may find the above, the information-based images are a feast for the eyes. An inspiration for anyone who needs to illustrate a point. Here are 200 different ways to go about assembling knowledge.
When communicating anything, beautifully designed materials are an asset. Thought his is not a business book – per se – if you’re feeling a lack of design vibes or graphic direction for your website, sales materials, reports, presentations or pitch decks – then aside from the vault of data contained inside – this book is for you. Essential.
